 |
NESSY |
|
NMR Relaxation Dispersion Spectroscopy Analysis Software for Windows, Mac and Linux |
||
| Home | Download | References | Tutorial | Manual | Links | Mailing List |
Manual
Functions are grouped according to the menu entries:
Menu |
Description of function |
|||||||||||||||||||||||||||||||||||||||||||||||||||||||||||||||||||||||||||||||||||||||||||||||||||
File: |
||||||||||||||||||||||||||||||||||||||||||||||||||||||||||||||||||||||||||||||||||||||||||||||||||||
New |
Empties all settings an variables to start a new NESSY project. |
|||||||||||||||||||||||||||||||||||||||||||||||||||||||||||||||||||||||||||||||||||||||||||||||||||
Open |
Opens a saved NESSY project. |
|||||||||||||||||||||||||||||||||||||||||||||||||||||||||||||||||||||||||||||||||||||||||||||||||||
Save |
Saves a NESSY project. |
|||||||||||||||||||||||||||||||||||||||||||||||||||||||||||||||||||||||||||||||||||||||||||||||||||
Save as |
Saves a NESSY project under new name. |
|||||||||||||||||||||||||||||||||||||||||||||||||||||||||||||||||||||||||||||||||||||||||||||||||||
| Opened Projects | List of NESSY projects that were loaded previously. | |||||||||||||||||||||||||||||||||||||||||||||||||||||||||||||||||||||||||||||||||||||||||||||||||||
Quit |
Closes NESSY. Note that running calculations will be aborted. |
|||||||||||||||||||||||||||||||||||||||||||||||||||||||||||||||||||||||||||||||||||||||||||||||||||
|
|
|||||||||||||||||||||||||||||||||||||||||||||||||||||||||||||||||||||||||||||||||||||||||||||||||||
Import: |
|
|||||||||||||||||||||||||||||||||||||||||||||||||||||||||||||||||||||||||||||||||||||||||||||||||||
Load Structure File |
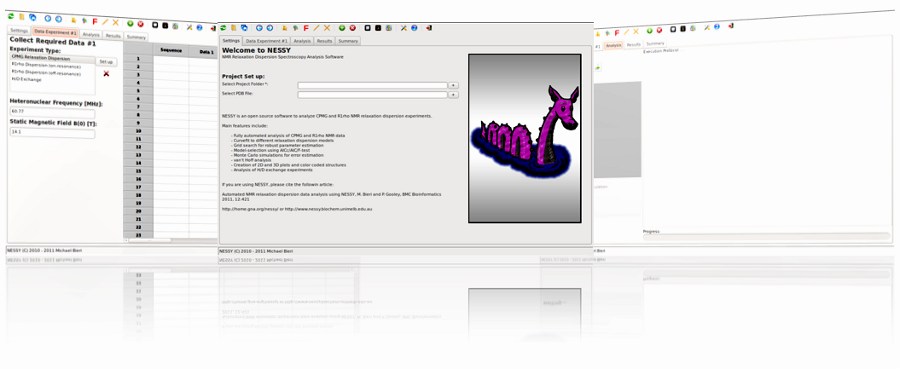
Reads the sequence of a PDB file. Numbering will be identical to numbering of PDB structure. It is recommended to read in the sequence from a PDB file, as it is the most convenient way to have it synchronized with you data and results. Note that only colour and width coded strcutures can be viewed if a PDB file was selected/imported. |
|||||||||||||||||||||||||||||||||||||||||||||||||||||||||||||||||||||||||||||||||||||||||||||||||||
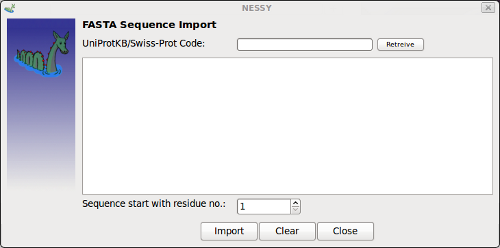
| Load FASTA sequence | Opens up a dialog to add protein sequence in FASTA format.
The suequence can be retreived from the internet by indicating UniProtKB/Swiss-Prot code (www.expasy.ch) or by writing/pasting it in the panel. If the sequence is not starting with residue no. 1 of the curent project, this can be set. By pushing the clear button, the loaded sequence will be deleted from the Data tab. |
|||||||||||||||||||||||||||||||||||||||||||||||||||||||||||||||||||||||||||||||||||||||||||||||||||
Import Data from Single File |
Use this function to import a peak list to you NESSY session. First, you have to load the peak list (Datafile). Then you can specify in which data set row the data should be imported. NESSY is able to import (almost) all peak lists. Therefore, the column number of the assignment (column where residue number is) and the intensity has to be specified. Note that numbering starts with the first real entry. Finally, you can choose between different peak file formats. Sparky, Xeasy and NMR View peak file formats can be selected. In addition, you have the oppurtunity to indicate whether your peak list is a space/tabulator or semicolon separated text file. Example (Sparky peak list):
|
|||||||||||||||||||||||||||||||||||||||||||||||||||||||||||||||||||||||||||||||||||||||||||||||||||
Import Data from Multiple Files |
Use this function to import mutiple peak lists at once with the same format. Set up is similar than Import Data from Single File, except you can select multiple files and you specify the dataset from where the data will be appended. |
|||||||||||||||||||||||||||||||||||||||||||||||||||||||||||||||||||||||||||||||||||||||||||||||||||
Import VD List |
This function allows you to import the vd list of your (Bruker) CPMG experiment. CPMG frequencies are listed in the vd list and will be imported directly in you NESSY session. |
|||||||||||||||||||||||||||||||||||||||||||||||||||||||||||||||||||||||||||||||||||||||||||||||||||
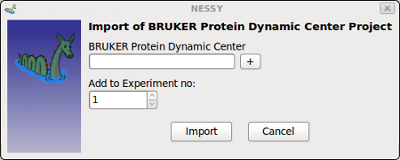
| Import BRUKER Protein Dynamic Center Project | This function is used to import projects started with BRUKER's Protein Dynamics Center (PDC).
Use PDC to export the project as text file (see PDC manual) and select this file in the dialog shown above. If you are using multiple experiments (for global fit), you can specify in which project the data has to be loaded. |
|||||||||||||||||||||||||||||||||||||||||||||||||||||||||||||||||||||||||||||||||||||||||||||||||||
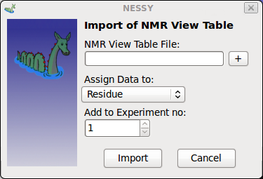
| Import NMR View Table | This function can be used to import table craeted using NMR View in the relaxation panel (Fit table):
Users can select if intensities are assigned to peak or residue number.
NESSY will read and assing data automatically to either the peak numbering or the residue numberinto the data grid. If assign to peak is selected,color-coded PyMol marcos will not map results corrected onto the structure. |
|||||||||||||||||||||||||||||||||||||||||||||||||||||||||||||||||||||||||||||||||||||||||||||||||||
| Data: | ||||||||||||||||||||||||||||||||||||||||||||||||||||||||||||||||||||||||||||||||||||||||||||||||||||
Correction of Residue Numbering |
Shifts your sequence up or downwards. |
|||||||||||||||||||||||||||||||||||||||||||||||||||||||||||||||||||||||||||||||||||||||||||||||||||
Correction of Data Assignment |
Shifts you data up or downwards. |
|||||||||||||||||||||||||||||||||||||||||||||||||||||||||||||||||||||||||||||||||||||||||||||||||||
Erase Data Set |
Function to delete single data sets. |
|||||||||||||||||||||||||||||||||||||||||||||||||||||||||||||||||||||||||||||||||||||||||||||||||||
Settings: |
||||||||||||||||||||||||||||||||||||||||||||||||||||||||||||||||||||||||||||||||||||||||||||||||||||
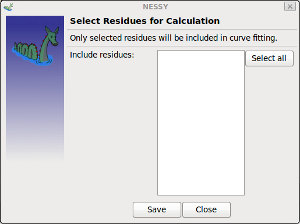
| Select residues to include in calculation | Opens a dialog where users can select/deselect residues, which are included in further analysis.
Residues previously loaded into the project (by FASTA or pdb) can be selected. Entire protein, only few or single residues can be selected. |
|||||||||||||||||||||||||||||||||||||||||||||||||||||||||||||||||||||||||||||||||||||||||||||||||||
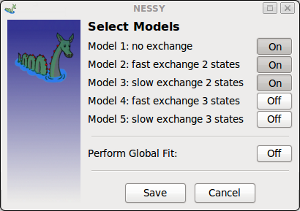
| Select Models | opens a dialog to enable/disable individual models.
By default, modles 1 - 3 are active. Each model, except of model 1, can be switched off or on. If multiple experiments are set up, data can be globally fit. To do so, Global Fit model has to be activated. Now, data is only globally fitted to selected models. If multiple experiments are set up, but Global Fit is not activated, experiments are individually fitted. Note: Selection of models is saved in NESSY projects, but Global Fit has to be activated after leading the experiments! |
|||||||||||||||||||||||||||||||||||||||||||||||||||||||||||||||||||||||||||||||||||||||||||||||||||
| Boundaries / Initial Guess | In this dialog, boundaries of the parameters used during curve fitting and grid search are set. In addition, initial guess / parameters can be specified. This initial parameters are only used if grid search is disabled (see below). | |||||||||||||||||||||||||||||||||||||||||||||||||||||||||||||||||||||||||||||||||||||||||||||||||||
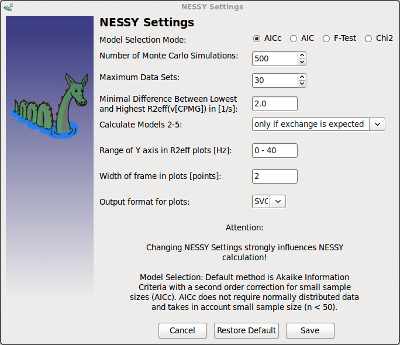
NESSY Settings |
You can set properties for you data analysis:
NESSY uses AICc model selection as default, as normal distribution of data can not be assumed (as necessary for F-Tests). Nevertheless, settings can be changed and defaults can be resored at any time of and during your calculation. Note that if you change settings during the calculation, your data might not be uniformly analyzed. |
|||||||||||||||||||||||||||||||||||||||||||||||||||||||||||||||||||||||||||||||||||||||||||||||||||
| n-States: | ||||||||||||||||||||||||||||||||||||||||||||||||||||||||||||||||||||||||||||||||||||||||||||||||||||
| Fast Exchange | Opens up dialog to perform fit to 2-9 states models in fast exchange.
Residues to analyze and limit for number of states can be specified. |
|||||||||||||||||||||||||||||||||||||||||||||||||||||||||||||||||||||||||||||||||||||||||||||||||||
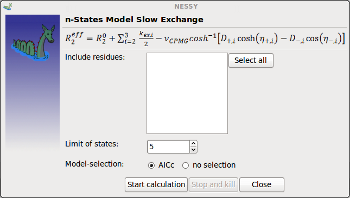
Slow Exchange |
Opens up dialog to perform fit to 2-9 states models in slow exchange.
Residues to analyze and limit for number of states can be specified. |
|||||||||||||||||||||||||||||||||||||||||||||||||||||||||||||||||||||||||||||||||||||||||||||||||||
Extras: |
||||||||||||||||||||||||||||||||||||||||||||||||||||||||||||||||||||||||||||||||||||||||||||||||||||
PEAKY |
Automatic peak picking and assignment tool (not implemented yet !). |
|||||||||||||||||||||||||||||||||||||||||||||||||||||||||||||||||||||||||||||||||||||||||||||||||||
Back calculate intensities |
Calculates and normalizes dispersion data of independent experiment to your session to implement additional data sets. This function can be used for:
The main function is to make a baseline correction of independent experiment so data can be fitted together to dispersion models. This functions generates artificial Sparky-formatted peak lists that can be imported into your current session. NESSY calculates R2eff of your additional datasets and back calculates intensities (normalized according to reference spectra of your NESSY session). This allows to import and combine data of different experiments. |
|||||||||||||||||||||||||||||||||||||||||||||||||||||||||||||||||||||||||||||||||||||||||||||||||||
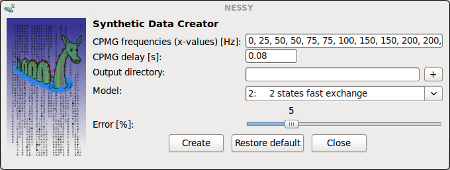
Create Synthetic data |
This function can be used to create synthetic data for models 2-5.
CPMG frequencies can be specified (separated by comma) as well as the constant time for the CPMG pulse train. Synthetic peak lists (in Sparky format) will be generated and saved in selected folder for specified model. The error, which will be introduced, can be set using the slider. |
|||||||||||||||||||||||||||||||||||||||||||||||||||||||||||||||||||||||||||||||||||||||||||||||||||
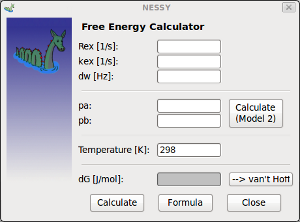
| Calculate free Energy dG | Free energy can be calcuated out of relaxation dispersion experiments.
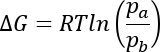
By inserting dynamics parameters calcuated by NESSY, free energy (dG) can be calculated. If model 2 (fast exchange) was selected, populations can be calcualted if dw (shift differences) are known (e.g. for binging experiments). Calculated dG values can be directly passed to van't Hoff analysis (see below). Formula:
|
|||||||||||||||||||||||||||||||||||||||||||||||||||||||||||||||||||||||||||||||||||||||||||||||||||
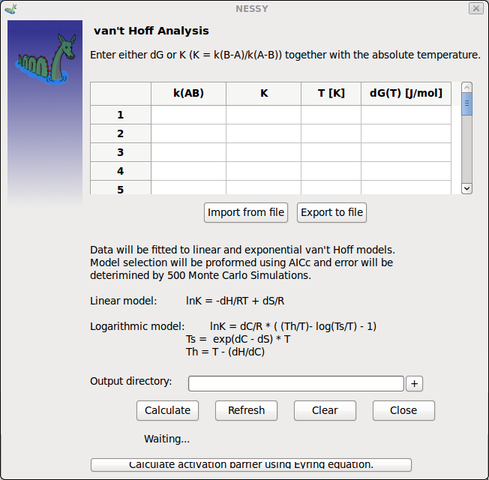
| van't Hoff Analysis | If relaxation dispersion experiments are performed at different temperatures, van't Hoff analysis can be used to calculate Enthalpy and Entropy.
The linear and non-linear van't Hoff models are included for calculation. Either dG (free energy) can be added to data grid (manually or directly after calculation; see above) or K (= k(b-a) / k(a-b)) together with the temperature in Kelvin. Data does not have to be obtained by NESSY calculation. This function can be used to perform van't Hoff analysis for different experiments.
Values can be entered either manually directly in the data grid or read out of a text file. NESSY detects dG, T, kab and K, but it is mendatory to have these parameters in the header of the text file:
in addition, data can be imported during NESSY startup using the command: $ ./nessy --vanthoff [name of text file] |
|||||||||||||||||||||||||||||||||||||||||||||||||||||||||||||||||||||||||||||||||||||||||||||||||||
| Export/Save log | Execution protocol can be saved in a text file to track calculation. | |||||||||||||||||||||||||||||||||||||||||||||||||||||||||||||||||||||||||||||||||||||||||||||||||||
| Plotting: | ||||||||||||||||||||||||||||||||||||||||||||||||||||||||||||||||||||||||||||||||||||||||||||||||||||
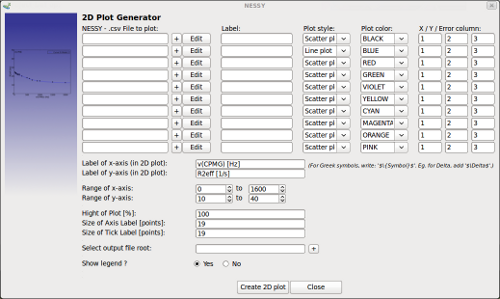
| Create 2D plot | This function can be used to greate custom made 2D plots.
Either a NESSY csv file or any other text file (tabulator, space, comma or semicolon separated columns) can be loaded into dialog. For each data set, a figure legend can be indicated. In addition, users have the choice between6 different plot styles (including energy landscapes) and can select the color for the data set. The colomn number of x-, y- and error-values are specified per data set (column numbering starts with 1 for the first column; white space does not cound). Data can be edited using in built editor (Edit button). In addition, data can be manually entered using the editor. In addition, labels of x and y axis as well as the range can be set. The dimenstions of x / y axis can be set by indicating the percentage of the y axis in relation to the x axis. The thickness of the plot box is set in NESSY settings. A file root for the plots has to be given. Two files are created: a png file, which will be added to the results tab in the NESSY main windows, and a vector graphics plot (depending on the selection in NESSY settings). Note that NESSY plot generator can also be used to plot data not obtained by NESSY. Any data in text files can be inserted (comma or semicolon separated data). Location of important data (x, y or error) can be selected. |
|||||||||||||||||||||||||||||||||||||||||||||||||||||||||||||||||||||||||||||||||||||||||||||||||||
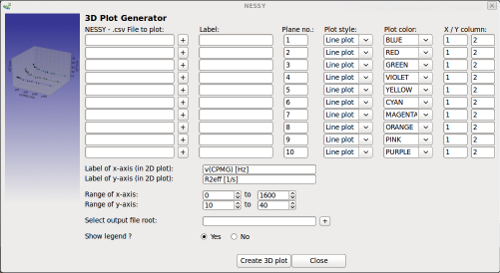
| Create 3D plot | This function can be used to greate custom made 3D plots.
3D plot generator works identical as the 2D plot generator. NESSY or any other text file can be used as source. The only difference is that the 3rd dimension can be specified using the 'Plane no.' text field. Multiply data sets can have the same plane number. This is usefull to plot a scatter plot with data points and a linear plot, which is the regression, in the same plane. |
|||||||||||||||||||||||||||||||||||||||||||||||||||||||||||||||||||||||||||||||||||||||||||||||||||
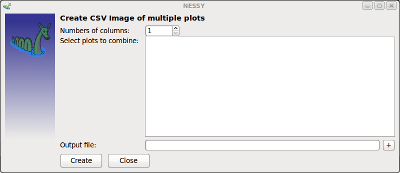
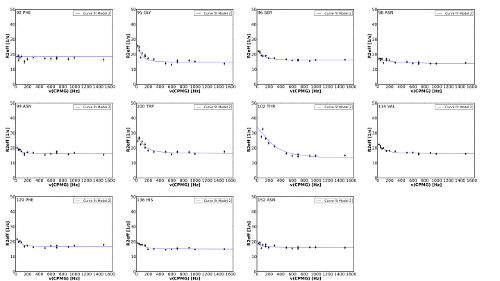
| Create Multiple Alignments of Plots | This function can be used to craete a SVG graphic of multiple aligned plots.
The number of columns can be selected. NESSY calculates the corresponding numbers of rows. If a NESSY project is loaded or data was analyzed, plots created during analysis will be added to the list in the dialog shown above. Altenatively, SVG files can be drag&dropped into the plots field. A SVG garphics of the plots (or graphics selected) will be created. Note that plots are sorted by increasing residue number!
This function is very usefull to generate an ensemble of individual fits foeach residue to present in supplementary materials. Time to generate the plot above was less than 1 minute! |
|||||||||||||||||||||||||||||||||||||||||||||||||||||||||||||||||||||||||||||||||||||||||||||||||||
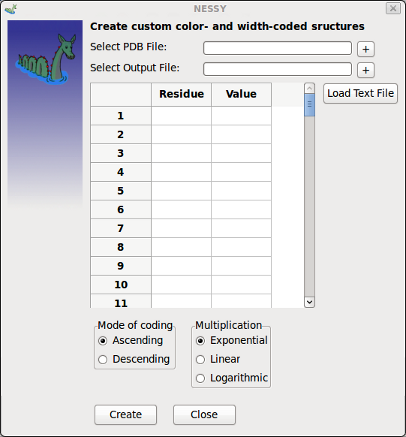
| Create Color Coded Structures | This function allows to generate custom color- and width coded structures (PyMol macros).
Any values can be given and assigned to a residue number. A PDB structure file and an output file has to be selected. Values can be entered manually into the data grid or read out of a text file. Values in the files have to be grouped by residue number in first column and value in second column. Columns can be separated either by space, tabulator, comma or semicolon. Different coding modes can be selected, too. |
|||||||||||||||||||||||||||||||||||||||||||||||||||||||||||||||||||||||||||||||||||||||||||||||||||
| Help: | ||||||||||||||||||||||||||||||||||||||||||||||||||||||||||||||||||||||||||||||||||||||||||||||||||||
| Manual | This manual will appear. | |||||||||||||||||||||||||||||||||||||||||||||||||||||||||||||||||||||||||||||||||||||||||||||||||||
| Tutorial | Follow the totorial to learn how to use NESSY's basic functions. | |||||||||||||||||||||||||||||||||||||||||||||||||||||||||||||||||||||||||||||||||||||||||||||||||||
| GNU GPL License | Read the GPL license of NESSY. | |||||||||||||||||||||||||||||||||||||||||||||||||||||||||||||||||||||||||||||||||||||||||||||||||||
| NESSY mailing list | Join the NESSY mailing list on http://gna.org/mail/?group=nessy | |||||||||||||||||||||||||||||||||||||||||||||||||||||||||||||||||||||||||||||||||||||||||||||||||||
| Contact NESSY | Write an email to the NESSY mailing list (using default mail program). | |||||||||||||||||||||||||||||||||||||||||||||||||||||||||||||||||||||||||||||||||||||||||||||||||||
| Update | If you installed the SVN version of NESSY, you can synchronize NESSY with further developments. | |||||||||||||||||||||||||||||||||||||||||||||||||||||||||||||||||||||||||||||||||||||||||||||||||||
| Startup commands: | ||||||||||||||||||||||||||||||||||||||||||||||||||||||||||||||||||||||||||||||||||||||||||||||||||||
NESSY can be started using different arguments:
File: NESSY project file to open upon start up. Arguments: |
||||||||||||||||||||||||||||||||||||||||||||||||||||||||||||||||||||||||||||||||||||||||||||||||||||
| -h | Displaying help text. | |||||||||||||||||||||||||||||||||||||||||||||||||||||||||||||||||||||||||||||||||||||||||||||||||||
| -p | Prints out original publication. | |||||||||||||||||||||||||||||||||||||||||||||||||||||||||||||||||||||||||||||||||||||||||||||||||||
| --vanthoff | Input for van't Hoff analysis (dG or K) are read
from the Input file (add header 'T' for temperatur, 'K' for K (kba/kab), 'dG' for dG or kab for k(AB), separated by whitespace). |
|||||||||||||||||||||||||||||||||||||||||||||||||||||||||||||||||||||||||||||||||||||||||||||||||||
| --debug | Start NESSY in debugging mode (no error redirection, skipping data evaluation). |
|||||||||||||||||||||||||||||||||||||||||||||||||||||||||||||||||||||||||||||||||||||||||||||||||||
| --noredir | Error message is not redirected to error dialog. | |||||||||||||||||||||||||||||||||||||||||||||||||||||||||||||||||||||||||||||||||||||||||||||||||||
| --plot | Loads plots of list file (containing list of svg filenames) and opens dialog to craete multiple plot alignment. | |||||||||||||||||||||||||||||||||||||||||||||||||||||||||||||||||||||||||||||||||||||||||||||||||||

For further questions or support please suscribe at our mailing list.